Math by Thomas Swing RangeMath by Thomas Swing Range is a simple yet powerful tool designed to visually highlight key swing levels in the market based on a user-defined lookback period. It identifies the highest high, lowest low, and calculates the midpoint between them — creating a clear range for swing trading strategies.
These levels can help traders:
Spot potential support and resistance zones
Analyze price rejection near range boundaries
Frame mean-reversion or breakout setups
The indicator continuously updates and extends these lines into the future, making it easier to plan and manage trades with visual clarity.
🛠️ How to Use
Add to Chart:
Apply the indicator on any timeframe and asset (works best on higher timeframes like 1H, 4H, or Daily).
Configure Parameters:
Lookback Period: Number of candles used to detect the highest high and lowest low. Default is 20.
Extend Lines by N Bars: Number of future bars the levels should be projected to the right.
Interpret Lines:
🔴 Red Line: Swing High (Resistance)
🟢 Green Line: Swing Low (Support)
🔵 Blue Line: Midpoint (Mean level — useful for equilibrium-based strategies)
Trade Ideas:
Bounce trades from swing high/low zones.
Breakout confirmation if price closes strongly outside the range.
Reversion trades if price moves toward the midpoint after extreme moves.
在脚本中搜索"swing high"

Wick SweepThe Wick Sweep indicator identifies potential trend reversal zones based on price action patterns and swing points. Specifically, it looks for "Wick Sweeps," a concept where the market temporarily breaks a swing low or high (creating a "wick"), only to reverse in the opposite direction. This pattern is often indicative of a market attempting to trap traders before making a larger move. The indicator marks these zones using dashed lines, helping traders spot key areas of potential price action.
Key Features:
* Swing Low and High Detection: The indicator identifies significant swing lows and highs within a user-defined period by employing Williams fractals.
* Wick Sweep Detection: Once a swing low or high is identified, the indicator looks for price movements that break through the low or high (creating a wick) and then reverses direction.
* Fractal Plotting: Optionally, the indicator plots fractal points (triangle shapes) on the chart when a swing low or high is detected. This can assist in visually identifying the potential wick sweep areas.
* Line Plotting: When a wick sweep is detected, a dashed line is drawn at the price level of the failed low or high, visually marking the potential reversal zone.
Inputs:
* Periods: The number of bars used to identify swing highs and lows. A higher value results in fewer, more significant swing points.
* Line Color: The color of the dashed lines drawn when a wick sweep is detected. Customize this to match your chart's theme or preferences.
* Show Fractals: A toggle that, when enabled, plots triangle shapes above and below bars indicating swing highs (up triangles) and swing lows (down triangles).
Functionality:
* Swing High and Low Calculation:
- The indicator calculates the swing low and swing high based on the periods input. A swing low is identified when the current low is the lowest within a range of (2 * periods + 1), with the lowest point being at the center of the period.
- Similarly, a swing high is identified when the current high is the highest within the same range.
* Wick Sweep Detection:
- Once a swing low or high is detected, the script looks for a potential wick. This happens when the price breaks the swing low or high and then reverses in the opposite direction.
- For a valid wick sweep, the price should briefly move beyond the identified swing point but then close in the opposite direction (i.e., a bullish reversal for a swing low and a bearish reversal for a swing high).
- A line is drawn at the price level of the failed low or high when a wick sweep is confirmed.
Confirmations for Reversal:
* The confirmation for a wick sweep requires that the price not only break the swing low/high but also close in the opposite direction (i.e., close above the low for a bullish reversal or close below the high for a bearish reversal).
* The confirmation is further refined by checking that the price movement is within a reasonable distance from the original swing point, which prevents the indicator from marking distant, unimportant price levels.
Additional Notes:
* The Wick Sweep indicator does not provide standalone trading signals; it is best used in conjunction with other technical analysis tools, such as trend analysis, oscillators, or volume indicators.
* The periods input can be adjusted based on the trader’s preferred level of sensitivity. A lower period value will result in more frequent swing points and potentially more signals, while a higher value will focus on more significant market swings.
* The indicator may work well in ranging markets where price tends to oscillate between key support and resistance levels.

Swing Point Indicator🔍 How does it work?
He looks at a candle and compares it with a number of candles to the left and right.
If that candle is the highest of that group, then it is a swing high.
If that candle is the lowest, then it is a swing low.
📈 What do you use it for?
Reading market structure:
You can easily see higher highs / higher lows (bullish structure)
Or lower highs / lower lows (bearish structure)
Determining BOS & CHoCH:
If a new swing low breaks below the previous one → Break of Structure (BOS)
If you go from HH/HL to LH/LL → Change of Character (CHoCH)
Finding entry and exit points:
You know where to expect price reactions (at swing points)
Good for pullback entries or stop loss placement
Drawing smart zones:
You can draw from swing high to swing low for Fibs, order blocks or S&D zones
*** Translated with www.DeepL.com (free version) ***

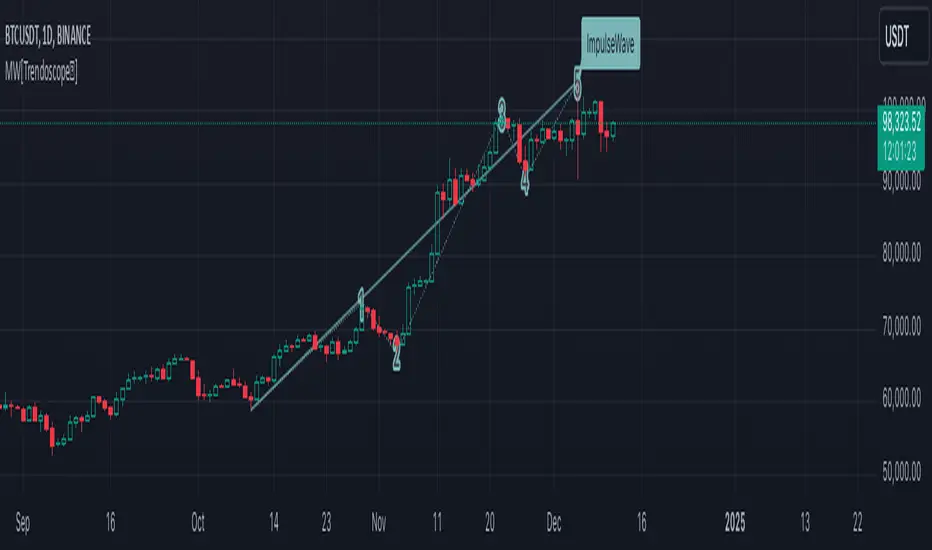
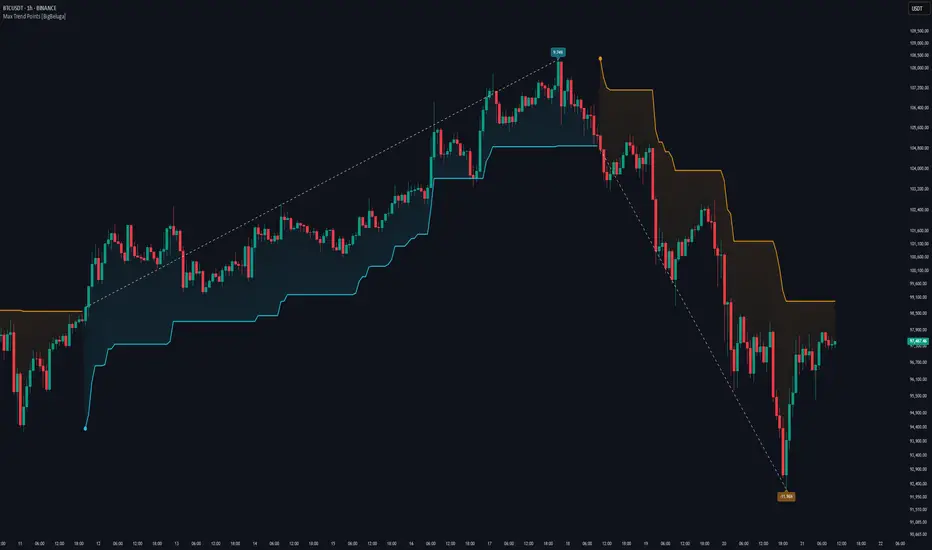
Max Trend Points [BigBeluga]🔵 OVERVIEW
A clean and powerful tool for identifying major trend shifts and quantifying the strength of each move using dynamically calculated price extremes.
This indicator helps traders visualize the most significant trend changes by plotting trend direction lines and dynamically tracking the highest or lowest point within each trend leg. It’s ideal for identifying key price impulses and measuring their magnitude in real time.
🔵 CONCEPTS
Uses an adaptive trend-following logic based on volatility envelopes created from HMA of the price range (high - low).
Identifies trend direction and flips when price breaks above or below these dynamic envelopes.
Tracks swing highs and lows within the current trend leg to highlight trend extremes.
Calculates and displays the percentage gain or drop from trend start to trend peak/valley.
🔵 FEATURES
Trend Shift Detection:
Plots a colored trend line (uptrend or downtrend) that updates based on price action volatility.
Impulse Mapping:
Draws a dashed line between the point of trend change (close) and the current trend leg's extreme (highest high or lowest low).
Percentage Labeling:
Displays a floating label showing the exact percent change from the trend start to the current extreme.
Real-Time Adjustments:
As the trend progresses, the extreme point and the percent label update automatically to reflect new highs/lows.
🔵 HOW TO USE
Look for the trend color shift and circular marker to identify a new potential trend direction.
Use the dashed lines and percent label to evaluate the strength and potential maturity of each move.
Combine this tool with support/resistance levels or other indicators to identify confluence zones.
Adjust the "Factor" input to make the trend detection more or less sensitive depending on your timeframe.
🔵 CONCLUSION
Max Trend Points is an efficient visual indicator for understanding the structure and magnitude of trending moves. It provides essential feedback on how far a trend has traveled, where momentum may be peaking, and when a shift may be underway—all with real-time adaptability and clean presentation.
ICT SMC Liquidity Grabs and OBsICT SMC Liquidity Grabs + Order Blocks + Fibonacci OTE Levels
A High-Probability Entry Engine for Smart Money Concept Traders
This script combines three powerful Smart Money Concepts (SMC) into a single tool: Liquidity Grabs, Order Block Zones, and Fibonacci OTE Levels, allowing traders to identify institutional entry models with clean, rule-based visual signals.
It’s designed to simplify SMC trading by highlighting confluence zones where price is likely to reverse or continue — with clear visual zones, entry arrows, and take profit projections.
🔍 What This Script Does:
Detects Liquidity Grabs
Identifies when price sweeps above/below the highest high or lowest low within a user-defined lookback period and closes back inside.
Plots orange labels on the chart to signal potential liquidity events (LG-H / LG-L).
Plots Order Blocks After Liquidity Grabs
After a liquidity grab, the script looks for displacement candles (strong bullish or bearish moves) and draws highlighted OB zones extending several bars to the right.
These zones represent potential institutional footprints for price reversals.
Draws Fibonacci OTE Levels (Optimal Trade Entry)
Uses recent swing high and low pivots to automatically calculate OTE zones (default: 62% and 75% retracement levels).
Draws these retracement zones for both bullish and bearish setups.
Marks Valid OTE Entry Zones
Buy/Sell zones only trigger when:
A liquidity grab occurs,
Price enters the OTE zone,
And a strong confirming candle is present.
Plots green/red arrows for valid buy/sell OTE entries.
Auto-Draws Take Profit Zones
TP1 = Previous swing high/low
TP2 = Risk-based R-multiplied extension (e.g., 1.5R — customizable)
Alerts
Triggers alerts when valid buy or sell OTE setups are detected.
⚙️ Customization Features:
Toggle each feature: Liquidity Grabs, Order Blocks, Fibonacci OTE levels
Set Fibonacci retracement percentages (e.g., 0.62 / 0.75)
Adjust lookback window for liquidity detection
Customize the take-profit multiplier (R-based)
Full control over visuals: colors, labels, and lines
💡 How to Use:
Use this script to scan for high-confluence trade setups based on Smart Money principles.
Combine with session timing (e.g., New York open), major swing structure, or Kill Zone windows for maximum edge.
Look for arrows inside OB zones or OTE levels following liquidity sweeps for cleaner entries.
🔗 Works Best With:
✅ First FVG — Opening Range Fair Value Gap Detector: Identify early inefficiencies to set the narrative for the day.
✅ Liquidity Levels — Smart Swing Lows: Spot key structural lows that can fuel stop hunts and reversals.
✅ ICT Turtle Soup — Liquidity Reversal: Add a classic reversal pattern to your toolkit to catch fakeouts cleanly.
Together, these tools build a complete Smart Money ecosystem for entry precision, risk management, and price behavior forecasting.

ICT SMC Liquidity Grabs and OBsICT SMC Liquidity Grabs + OB + Fibonacci OTE Levels
Smart Money Concepts Trading Assistant
This script is built for traders who follow ICT (Inner Circle Trader) and Smart Money Concepts. It intelligently combines three critical components of SMC trading: Liquidity Grabs, Order Blocks, and Fibonacci-based Optimal Trade Entry (OTE) zones — giving traders visual cues for potential high-probability reversals and entry points.
🔍 What This Script Does:
Detects Liquidity Grabs
Identifies swing highs/lows where price sweeps liquidity, then immediately reverses.
Labels them with orange markers when price takes out previous highs/lows but closes back inside.
Draws Order Blocks
After a liquidity grab, the script looks for strong bullish or bearish candles and automatically highlights the OB zone.
These OB zones are visualized with transparent colored boxes extending several bars forward.
Plots Fibonacci OTE Levels
Uses recent swing high/low pivots to dynamically draw customizable OTE retracement levels (e.g., 62% and 75%) for both long and short setups.
Highlights Optimal Entry Zones
Marks valid OTE-based buy/sell opportunities only when:
Liquidity has been taken,
Price enters the OTE zone,
And a strong confirming candle appears.
Adds visual zones, trade labels, and optional alerts for each qualified entry.
Includes Take Profit Targets
Automatically calculates take-profit levels based on previous structure and risk-reward ratios.
TP1 is the previous swing, and TP2 is an extended R-multiple (customizable by user).
⚙️ Customization Options:
Toggle each feature (Liquidity Grabs, OBs, Fibonacci Levels)
Adjust Fibonacci levels (default: 62% and 75%)
Set lookback period for liquidity checks
Customize the R-multiple for TP2 levels
💡 How to Use:
Enable desired features from the input panel.
Watch for Buy/Sell OTE zones highlighted in green/red.
Confirm with liquidity sweep and OB support for stronger signals.
Use the automatically generated TP levels to manage risk.
🚀 What Makes It Unique:
Unlike other open-source mashups, this script synchronizes multiple SMC concepts into a single tool that:
Waits for high-confidence conditions (not just blind fib or OB detection)
Validates entries using multiple confluences
Visually marks actionable setups
Automates trade management zones
Whether you're trend-trading, scalping, or swing trading ICT-style, this tool offers a streamlined, smart-money-aligned workflow directly on your chart.

FVG + Swings + ConfigurableOverview
This Pine Script v5 indicator highlights Fair Value Gaps (FVGs), plots swing‑high and swing‑low pivots, and marks single breakouts above the last swing‑high or below the last swing‑low by recoloring the breakout candle. Every aspect—gap size, count limits, colors, and feature toggles—is exposed as an input so you can tailor it to your own workflow.
Key Features
Fair Value Gaps
Detects bullish gaps when the high of bar i-2 is below the low of the current bar.
Detects bearish gaps when the low of bar i-2 is above the high of the current bar.
Draws a semi‑transparent rectangle spanning from bar i-2 to bar i + extension.
Automatically deletes oldest boxes when exceeding the user’s “Max FVG Boxes” limit.
Swing‑High / Swing‑Low Pivots
Identifies a swing‑high when the middle candle of a three‑bar sequence has the highest high.
Identifies a swing‑low when the middle candle has the lowest low.
Marks each pivot with a tiny dot above (high) or below (low) the bar.
Single Breakouts
Tracks the most recent swing‑high and swing‑low levels.
On the first close above the last swing‑high (or below the last swing‑low), recolors that single candle.
Prevents repeated coloring until a new swing pivot forms.
Full Customization
Show/Hide toggles for FVGs, swing pivots, breakouts.
Numeric inputs for FVG extension length and maximum retained boxes.
Color pickers for bullish/bearish gaps, swing pivots, and breakout candles.

MÈGAS ALGO : ZIG-ZAG CYCLE INSIGTH [INDICATOR]Overview
The Zig-Zag Cycle Insigth is a revisited version of the classic Zig Zag indicator, designed to provide traders with a more comprehensive and actionable view of price movements.
This advanced tool not only highlights significant price swings but also incorporates additional features such as cycle analysis, real-time data tracking, and Fibonacci retracement levels. These enhancements make it an invaluable resource for identifying trends, potential reversal points, and market structure.
This indicator adheres to TradingView's guidelines and is optimized for both technical analysts and active traders who seek deeper insights into market dynamics.
Key Features:
1. Customizable Thresholds for Price Movements:
- Users can set personalized thresholds for price movement percentages and time periods.
This ensures that only significant price swings are plotted, reducing noise and increasing
clarity.
- Straight lines connect swing highs and lows, providing a cleaner visual representation of
the trend.
2. Cycle Analysis Table:
- A dynamic table is included to analyze price cycles based on three key factors:
- Price Change: Measures the magnitude of each swing (high-to-low or low-to-high).
- Time Duration (Bar Count): Tracks the number of bars elapsed between consecutive swings,
offering precise timing insights.
- Volume: Analyzes trading volume during each segment of the cycle.
- The indicator calculates the **maximum**, **minimum**, and **mean** values for each
parameter across all completed cycles, providing deeper statistical insights into market
behavior.
- This table updates in real-time, offering traders a quantitative understanding of how price
behaves over different cycles.
3. Real-Time Data Integration:
- The indicator displays live updates of current price action relative to the last identified
swing high/low. This includes:
- Current distance from the last pivot point.
- Percentage change since the last pivot.
- Volume traded since the last pivot.
4. Fibonacci Retracement Levels:
- Integrated Fibonacci retracement levels are dynamically calculated based on the most
recent significant swing high and low.
- Key retracement levels (23.6%, 38.2%, 50%, 61.8%, and 78.6%) are plotted alongside the Zig
Zag lines, helping traders identify potential support/resistance zones.
- Extension levels (100%, 161.8%, etc.) are also included to anticipate possible breakout
targets.
5. Customizable Alerts:
- Users can configure alerts for specific real-time conditions, such as:
- Price Change
- Duration
- Volume
- Fibonacci Retracement Levels
How It Works:
1. Zig Zag Identification:
- The indicator scans historical price data to identify significant turning points where the
price moves by at least the user-defined percentage threshold.
- These turning points are connected by straight lines to form the Zig Zag pattern.
2. Cycle Analysis:
For each completed cycle (from one swing high/low to the next), the indicator calculates:
- Price Change: Difference between the start and end prices of the cycle.
- Maximum Price Change: The largest price difference observed across all cycles.
- Minimum Price Change: The smallest price difference observed across all cycles.
- Mean Price Change: The average price difference across all cycles.
- Time Duration (Bar Count): Number of bars elapsed between consecutive swings.
- Maximum Duration: The longest cycle in terms of bar count.
- Minimum Duration: The shortest cycle in terms of bar count.
- Mean Duration: The average cycle length in terms of bar count.
- Volume: Total volume traded during the cycle.
- Maximum Volume: The highest volume traded during any single cycle.
- Minimum Volume: The lowest volume traded during any single cycle.
- Mean Volume: The average volume traded across all cycles.
- These calculations provide traders with a statistical overview of market behavior, enabling
them to identify patterns and anomalies in price, time, and volume.
3. Fibonacci Integration:
- Once a new swing high or low is identified, the indicator automatically calculates Fibonacci
retracement and extension levels.
- These levels serve as reference points for potential entry/exit opportunities.
4. Real-Time Updates:
- As the market evolves, the indicator continuously monitors the relationship between the
current price and the last identified swing point.
- Real-time metrics, such as percentage change and volume, are updated dynamically.
5. Alerts Based on Real-Time Parameters:
- The indicator allows users to set customizable alerts based on real-time conditions:
- Price Change Alert: Triggered when the real-time price change is less or greater than a
predefined percentage threshold (e.g., > or < fixed value).
- Duration Alert: Triggered when the cycle duration (in bars) is less or greater than a
predefined
bar count threshold (e.g., > or < fixed value).
- Volume Alert: Triggered when the trading volume during the current cycle is less or greater
than a predefined volume threshold (e.g., > or < fixed value).
Advantages of Zig-Zag Cycle Insigth
- Comprehensive Insights: Combining cycle analysis, Fibonacci retracements, and real-time data
provides a holistic view of market conditions.
- Statistical Analysis: The inclusion of maximum, minimum, and mean values for price change,
duration, and volume offers deeper insights into market behavior.
- Actionable Signals: Customizable alerts ensure traders never miss critical market events based
on real-time price, duration, and volume parameters.
- User-Friendly Design: Clear visuals and intuitive controls make it accessible for traders of all
skill levels.
Reference:
TradingView/ZigZag
TradingView/AutofibRetracement
Please Note:
This indicator is provided for informational and educational purposes only. It is not financial advice, and it should not be considered a recommendation to buy, sell, or trade any financial instrument. Trading involves significant risks, including the potential loss of your entire investment. Always conduct your own research and consult with a licensed financial advisor before making any trading decisions.
The results and images provided are based on algorithms and historical/paid real-time market data but do not guarantee future results or accuracy. Use this tool at your own risk, and understand that past performance is not indicative of future outcomes.

Zig Zag Trend Metrics“ Zig Zag Trend Metrics ” is a highly versatile indicator, built on the classic Zig Zag concept and thoughtfully designed for technical traders seeking a deeper, more structured view of market dynamics. This tool identifies significant swing highs and lows, classifies them, and annotates each with key metrics, offering a precise snapshot of each movement. It enhances visual analysis by drawing connecting lines that outline the flow of market structure, making trend progression and reversals instantly recognizable. Beyond visual mapping, it features a compact, real-time statistics table that calculates the average price and time deltas for both bullish and bearish swings, giving traders deep insights into trend momentum and rhythm. With extensive customization options, this indicator adapts seamlessly to vast trading styles or chart setups, empowering traders to spot patterns, evaluate trend strength, and make more confident, data-backed decisions.
❖ FEATURES
✦ Automatic Swing Detection
At its core, this indicator automatically identifies swing highs and lows based on a customizable lookback period (default: 10 bars).
✦ Labeling Swing Points
Each swing is visualized with a label that includes:
Swing Classification : “HH” (Higher High), “LH” (Lower High), “LL” (Lower Low), or “HL” (Higher Low).
Price Difference : Displayed in percentage or absolute value from the previous opposite swing.
Time Difference : The number of bars since the previous swing of the opposite type.
These labels offer traders clear, immediate insight into price movements and structural changes.
✦ Visual Lines
The indicator draws three types of lines:
Bullish Lines: Connect recent swing lows to new swing highs, indicating uptrends.
Bearish Lines: Connect recent swing highs to new swing lows, indicating downtrends.
Range Lines: Connect consecutive highs or lows to outline price channels.
Each line type can be color-coded and customized for visibility.
✦ Statistics Table
An on-screen metrics table provides a live summary of trends. Script uses Relative Averaging to smooth price and time changes. This prevents outliers from distorting the data and provides a more reliable sense of typical swing behavior.
Uptrend Metrics: Shows average price and time differences from recent bullish swings.
Downtrend Metrics: Shows the same for bearish swings.
🛠️ Customization Options
Ability to tailor the indicator to suit their strategy and aesthetic preferences:
Swing Period: Adjust sensitivity to short- or long-term swings.
Color Settings: Customize line and label colors.
Label Display: Choose between absolute or percentage price differences.
Table Settings: Modify size, location, or visibility.
This makes the indicator highly flexible and useful across various timeframes and assets.

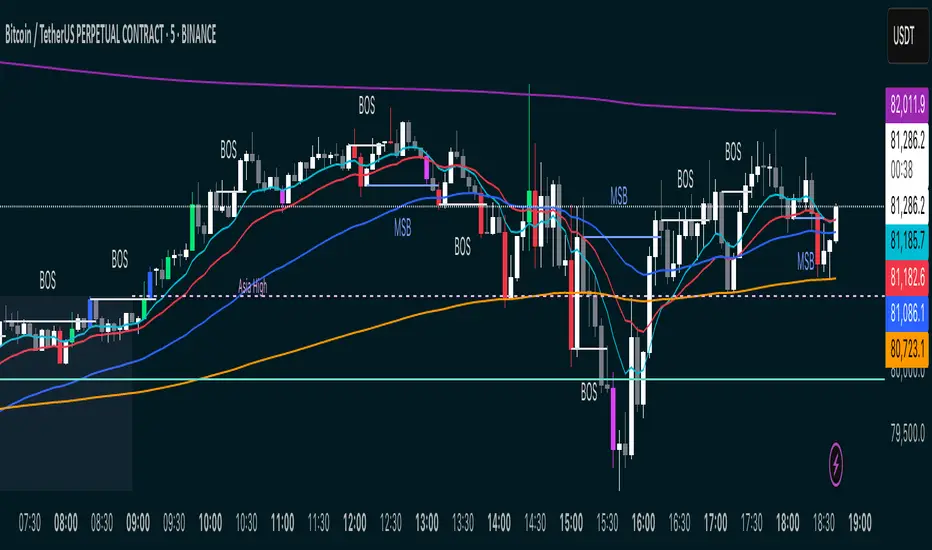
MSB BOS Market Structure [FTB]Track Market Structure Breaks (MSB) and Breaks of Structure (BOS) on your charts. This indicator does exactly that without clutter and with easy-to-spot.
🔑 Features:
MSB (Market Structure Break): Shows when price flips and breaks the previous high/low — possible start of a new trend.
BOS (Break of Structure): Highlights key structural breakouts in line with the existing trend.
✅ Pivot-Based Analysis (Body Focused)
Uses candle body-based pivot highs and lows to find clean market structure points (no wicks confusion here!).
Adjustable pivot strength — control how many candles you want on either side to define a swing.
✅ Clean Visual Markings
MSB and BOS lines with optional labels so you see exactly where breaks happen.
Customizable line style (Solid, Dashed, Dotted) to match your chart aesthetic.
Optional pivot markers to show minor swing highs/lows.
✅ Alerts Ready
Set alerts for any MSB or BOS, or filter to specific bullish/bearish breaks — never miss a key level again
💡 How to Use This Indicator:
Identify Trend Shifts: Use MSB to spot early trend reversals — when a previous structure breaks against the trend.
Catch Continuations: Watch for BOS to confirm trend continuation — great for riding the trend!
⚙️ Settings You Can Adjust:
Pivot Strength: How many candles to look back and forward for swing points (default: 3).
Show Pivots: Optional — highlight swing highs and lows for extra clarity.
WLI Swing High/Low advnc indicatorfor Class members
else
label.set_xy(lowMsg, bar_index, close)
label.set_text(lowMsg, "making New Low")
label.set_color(lowMsg, newSwingLowColor)
label.set_textcolor(lowMsg, color.white)
else
if not na(lowMsg)
label.delete(lowMsg)
lowMsg := na

Liquidity Location Detector [BigBeluga]
This indicator helps traders identify potential liquidity zones by detecting significant volume levels at key highs and lows. By using color intensity and scoring numbers, it visually highlights areas where liquidity concentration may be highest while incorporating trend analysis through EMAs.
🔵Key Features:
Liquidity Zone Detection: Automatically detects and marks areas where significant volume has accumulated at swing highs and lows.
Dynamic Box Plotting: Draws liquidity boxes at key highs and lows, updating based on market conditions.
Volume Strength Scaling: Uses a scoring system to rank liquidity zones, helping traders identify the strongest areas.
Color Intensity for Volume Strength: More transperent color indicate less liquidity, while less transperent represent stronger volume concentrations.
Customizable Display: Users can adjust the number of displayed liquidity zones and modify colors to suit their trading style.
Real-Time Liquidity Adaptation: As price interacts with liquidity zones, the indicator updates dynamically to reflect changing market conditions.
Auto-Stopping Liquidity Zones: Liquidity boxes automatically stop extending to the right once price crosses them, preventing outdated zones from interfering with live market action.
Trend Analysis with EMAs: Includes two optional EMAs (fast and slow) to help traders analyze market trends. Users can enable or disable these EMAs in the settings and use crossover signals for trend confirmation.
🔵Usage:
Identify Key Liquidity Areas: Use color intensity and transparency levels to determine high-impact liquidity zones.
Support & Resistance Confirmation: Liquidity zones can act as potential support and resistance levels, enhancing trade decision-making.
Market Structure Analysis: Observe how price interacts with liquidity to anticipate breakout or reversal points.
Scalping & Swing Trading: Works for both short-term and long-term traders looking for liquidity-based trade setups.
Liquidation Map Insight: A liquidity map highlights areas where large amounts of leveraged positions (both long and short) are likely to get liquidated. Since many traders use leverage, sharp price movements can trigger a cascade of liquidations, leading to rapid price surges or drops. Monitoring these liquidity zones and trends helps traders anticipate where price might react strongly.
Liquidity Location Detector is an essential tool for traders seeking to map out potential liquidity zones, providing deeper insights into market structure and trading volume dynamics.

SMC Liquidity & Order Blocks🔹 1. Moving Averages for Trend Confirmation
Uses Exponential Moving Averages (EMA) to determine trend direction.
9-period EMA (blue) and 15-period EMA (red) are plotted.
🔹 2. Liquidity Zones (Swing Highs & Lows)
Identifies liquidity zones where price is likely to react.
Buy-Side Liquidity: Highest high over 20 periods (Green line).
Sell-Side Liquidity: Lowest low over 20 periods (Red line).
🔹 3. Order Block Detection
Detects bullish and bearish order blocks (key price zones of institutional activity).
Bullish Order Block (OB): Formed when the highest close over 5 bars exceeds the highest high.
Bearish Order Block (OB): Formed when the lowest close over 5 bars is lower than the lowest low.
Plotted using green (up-triangle) for bullish OB and red (down-triangle) for bearish OB.
🔹 4. Fair Value Gaps (FVG)
Detects price inefficiencies (gaps between candles).
FVG Up: When a candle's high is lower than a candle two bars ahead.
FVG Down: When a candle's low is higher than a candle two bars ahead.
Plotted using blue circles (FVG Up) and orange circles (FVG Down).

Auto Wyckoff Schematic [by DanielM]This indicator is designed to automatically detect essential components of Wyckoff schematics. This tool aims to capture the critical phases of liquidity transfer from weak to strong hands, occurring before a trend reversal. While the Wyckoff method is a comprehensive and a very nuanced approach, every Wyckoff schematic is unique, making it impractical to implement all its components without undermining the detection of the pattern. Consequently, this script focuses on the essential elements critical to identifying these schematics effectively.
Key Features:
Swing Detection Sensitivity:
The sensitivity of swing detection is adjustable through the input parameter. This parameter controls the number of past bars analyzed to determine swing highs and lows, allowing users to fine-tune detection based on market volatility and timeframes.
Pattern Detection Logic:
Accumulation Schematic:
Detects consecutive lower swing lows, representing phases like Selling Climax (SC) and Spring, which often precede a trend reversal upward. After the final low is identified, a higher high is detected to confirm the upward trend initiation.
Labeled Key Points:
SC: Selling Climax, marking the beginning of the accumulation zone.
ST: Secondary Test during the schematic.
ST(b): Secondary Test in phase B.
Spring: The lowest point in the schematic, signaling a final liquidity grab.
SOS: Sign of Strength, confirming a bullish breakout.
The schematic is outlined visually with a rectangle to highlight the price range.
Distribution Schematic:
Detects consecutive higher swing highs, which indicate phases such as Buying Climax (BC) and UTAD, often leading to a bearish reversal. After the final high, a lower low is detected to confirm the downward trend initiation.
Labeled Key Points:
BC: Buying Climax, marking the beginning of the distribution zone.
ST: Secondary Test during the schematic.
UT: Upthrust.
UTAD: Upthrust After Distribution, signaling the final upward liquidity grab before a bearish trend.
SOW: Sign of Weakness, confirming a bearish breakout.
The schematic is visually outlined with a rectangle to highlight the price range.
Notes:
Simplification for Practicality: Due to the inherent complexity and variability of Wyckoff schematics, the indicator focuses only on the most essential features—liquidity transfer and key reversal signals.
Limitations: The tool does not account for all components of Wyckoff's method (e.g., minor phases or nuanced volume analysis) to maintain clarity and usability.
Unique Behavior: Every Wyckoff schematic is different, and this tool is designed to provide a simplified, generalized approach to detecting these unique patterns.

EMA with Bar Count
---
### **Key Features and Functionalities**
#### 1. **Multi-Timeframe Exponential Moving Averages (EMA)**
- The script calculates and plots EMAs for various timeframes (e.g., 1 minute, 5 minutes, 60 minutes, daily, and custom intervals).
- Users can customize the length and resolution of each EMA using inputs.
- Different colors are assigned to each EMA for easy identification on the chart.
#### 2. **Background Coloring**
- Optional background coloring (`bgcolor`) indicates whether the current price is above or below the 1-hour 20 EMA.
- Green indicates the price is above, and red indicates the price is below the EMA.
#### 3. **Bar Count Labeling**
- The script tracks bar counts and displays labels at specific intervals (e.g., every 3 bars).
- Label size and text color can be customized through user inputs.
#### 4. **Inside and Outside Bar Detection**
- Detects and highlights "Inside Bars" and "Outside Bars" on the chart.
- **Inside Bar**: The current bar's high and low are within the previous bar's range.
- **Outside Bar**: The current bar's range exceeds the previous bar's range.
- These patterns are marked with shapes for visual identification.
#### 5. **Bullish/Bearish Candle Streaks**
- Identifies and marks streaks of three consecutive bullish or bearish candles.
- **Bullish Streaks**: Marked with green shapes above the bar.
- **Bearish Streaks**: Marked with red shapes above the bar.
#### 6. **Time-Based Marking**
- The script includes an option to highlight specific time intervals (e.g., 7:30 AM) with a colored vertical line or background shading.
- Configurable time inputs allow flexibility.
#### 7. **Micro Gap Detection**
- Highlights gaps between the opening price of the current bar and the closing price of the previous bar.
- Blue shapes indicate bullish gaps.
- Purple shapes indicate bearish gaps.
#### 8. **TR (Trading Range) Detection**
- Identifies bars with significant overlap based on a user-defined threshold.
- Displays "TR" labels when overlap conditions are met.
#### 9. **Bar Coloring**
- Optionally colors bars based on specific conditions:
- Green: Bullish breakout (high and low higher than the previous bar, closing above the midpoint).
- Red: Bearish breakout (high and low lower than the previous bar, closing below the midpoint).
#### 10. **50% Midpoint Line**
- Displays a horizontal line at the 50% midpoint of the bar's range, customizable for the current or last bar only.
#### 11. **Pattern Detection**
- Recognizes specific candlestick patterns (e.g., IOI, OII, IOO).
- Provides alerts for detected patterns or predefined thresholds.
#### 12. **Alerts**
- Configurable alerts for:
- Specific patterns (e.g., IOI, OII, IOO).
- Bar range exceeding a user-defined threshold.
- Bullish or bearish streaks.
#### 13. **Gap Detector**
- Identifies gaps between bars and marks them with shaded boxes.
- Bullish gaps are shaded green, while bearish gaps are shaded red.
#### 14. **Advanced Customization**
- Extensive user inputs allow traders to tailor the indicator to their trading style.
- Includes support for various levels of detail (e.g., debug mode, label visibility, etc.).
#### 15. **ZigZag and Wedge Patterns**
- Optional zigzag lines to connect swing highs and lows.
- Detects wedge patterns using customizable settings for pivot points and angle differences.
---
### **Use Case Scenarios**
1. **Trend Identification**: Use multi-timeframe EMAs to confirm overall market direction.
2. **Range Trading**: Trade within ranges using detected inside and outside bars as key levels.
3. **Breakout Trading**: Use patterns like IOI and OII to anticipate breakouts.
4. **Scalping**: Exploit bullish and bearish streaks or micro gaps for quick trades.
5. **Pattern-Based Alerts**: Set up alerts for specific market conditions or candlestick patterns.
### **Why This Indicator Is Useful**
- Combines multiple trading tools into a single, customizable script.
- Saves time by automating complex calculations and pattern detections.
- Improves decision-making with clear visual cues and configurable alerts.
Let me know if you'd like any additional explanations or adjustments!

Dashboard MTF profile volume Indicator Description
This indicator, titled "Swing Points and Liquidity & Profile Volume," combines multiple features to provide a comprehensive market analysis:
Volume Profile: Displays buy and sell volumes across multiple timeframes (1 minute, 5 minutes, 15 minutes, 1 hour, 4 hours, 1 day).
Volume Moving Averages: Plots two moving averages (short and long) to analyze volume trends.
Dashboard: A summary dashboard shows buy and sell volumes for each timeframe, with distinct colors for better visualization.
Swing Points: Identifies liquidity levels and swing points to help pinpoint key entry and exit zones.
How to Use
1. Indicator Installation
Go to TradingView.
Open the Pine Script Editor.
Copy and paste the provided code.
Click on "Add to Chart."
2. Indicator Settings
The indicator offers several customizable parameters:
Display Volume (1 minute, 5 minutes, 15 minutes, 1 hour, 4 hours, 1 day): Enable or disable volume display for each timeframe.
Short Moving Average Length (MA): Set the short moving average period (default: 5).
Long Moving Average Length (MA): Set the long moving average period (default: 14).
Dashboard Position: Choose where to display the dashboard (bottom-right, bottom-left, top-right, top-left).
Text Color: Customize the text color in the dashboard.
Text Size: Choose text size (small, normal, large).
3. Using the Indicator
Volume Analysis
The dashboard displays buy (Buy Volume) and sell (Sell Volume) volumes for each timeframe.
Buy Volume: Volume of trades where the closing price is higher than the opening price (aggressive buying).
Sell Volume: Volume of trades where the closing price is equal to or lower than the opening price (aggressive selling).
Volumes are displayed in real-time and update with each new candle.
Volume Moving Averages
Two moving averages are plotted on the chart:
MA Volume (Short): Short moving average (blue) to identify short-term volume trends.
MA Volume (Long): Long moving average (red) to identify long-term volume trends.
Use these moving averages to spot accumulation or distribution periods.
Swing Points and Liquidity
Swing points are identified based on price levels where volumes are highest.
These levels can act as support/resistance zones or liquidity areas to plan entries and exits.
Usage Guidelines
1. Entering a Position
Buy (Long):
When Buy Volume is significantly higher than Sell Volume across multiple timeframes.
When the short moving average (blue) crosses above the long moving average (red).
Sell (Short):
When Sell Volume is significantly higher than Buy Volume across multiple timeframes.
When the short moving average (blue) crosses below the long moving average (red).
2. Exiting a Position
Use liquidity levels (swing points) to set profit targets or stop-loss levels.
Monitor volume changes to anticipate trend reversals.
3. Risk Management
Use stop-loss orders to limit losses.
Avoid trading during low-volume periods to reduce false signals.
Compliance with Trading View Guidelines
Intellectual Property:
The code is provided for educational and personal use. You may modify and use it but cannot resell or distribute it as your own work.
Responsible Use:
Trading View encourages responsible use of indicators. Test the indicator on a demo account before using it in live trading.
Transparency:
The code is fully transparent and can be reviewed in the Pine Script Editor. You may modify it to suit your needs.
Practical Examples
Scenario 1: Bullish Trend
Buy Volume is high on 1-hour and 4-hour time frames.
The short moving average (blue) is above the long moving average (red).
Action: Open a long position (Buy) and set a stop-loss below the last swing low.
Scenario 2: Bearish Trend
Sell Volume is high on 1-hour and 4-hour time frames.
The short moving average (blue) is below the long moving average (red).
Action: Open a short position (Sell) and set a stop-loss above the last swing high.

Dynamic Signal EngineDynamic Signal Engine
The Dynamic Signal Engine is a powerful and versatile indicator, designed to help traders make informed decisions by combining trend analysis with key support and resistance levels. This tool is inspired by the Linear Regression Oscillator , which laid the foundation for this enhanced implementation. By building on the original concept, this script introduces additional features, customization, and integration with dynamic trading strategies to suit diverse trading styles.
Key Features
Inspiration and Foundation
This indicator draws inspiration from the Linear Regression Oscillator , leveraging its robust trend detection capabilities while adding custom enhancements for broader functionality and user adaptability.
Trading Style Customization
Adaptable for Scalping, Intraday, and Swing Trading with dynamic parameter adjustments for each style.
User-defined inputs for thresholds, lookback periods, and visualization options provide further control.
Enhanced Linear Regression Oscillator (LRO)
A refined implementation of the LRO calculates deviations from a regression line, normalized for improved trend detection.
Identifies bullish and bearish crossovers with added alerts and visual markers.
Includes proximity alerts for critical thresholds to help traders anticipate key market movements.
Dynamic Support and Resistance Integration
Incorporates ENIGMA Signal Logic to identify swing highs and lows, dynamically marking them as fractal support and resistance levels.
When a sell signal from ENIGMA is generated, traders can choose to sell immediately or use the low of the previous candle as the entry point. Similarly, for a buy signal, traders can buy immediately or use the high of the previous candle for entry. These signals are visually indicated by a green triangle for buy signals, ensuring clear and actionable insights.
Advanced Visualization
Displays key levels with customizable horizontal lines (solid, dashed, or dotted) and labels for clarity.
Candle colours and mini arrows highlight trends and potential trading opportunities.
Real-Time Alerts
Alerts for LRO threshold crossings and swing-level breaches keep you updated without the need for constant monitoring.
Optimized for Usability
Designed to keep charts clean by limiting displayed trades and signals to recent activity.
Adjustable parameters ensure flexibility and a user-friendly experience.
How It Works
Trend Detection with Enhanced LRO
The indicator builds on the Linear Regression Oscillator , calculating oscillations of price movements and normalizing them for trend analysis. Crossovers and threshold proximity are visualized on the chart and trigger alerts for potential market shifts.
Dynamic Support and Resistance Levels
The ENIGMA Signal Logic identifies recent swing highs and lows, marking them as key levels. These levels are dynamically updated as new swing points are detected, providing actionable support and resistance zones.
Signal Confirmation
Buy or sell signals are confirmed when:
Price breaches the swing levels.
The LRO aligns with directional bias (e.g., bearish crossover for sell signals).
Signals are further clarified by ENIGMA's green triangle indicators, showing key buy and sell opportunities.
Visualization and Alerts
Signals are displayed using arrows, labelled horizontal lines, and optional candle colours. Alerts notify traders of key events, such as LRO threshold crossings or swing-level breaches.
How to Use
Choose your Trading Style: Scalping, Intraday, or Swing Trading. The indicator adjusts its default settings automatically.
Fine-tune parameters like LRO thresholds, line lengths, and the number of visible trades to suit your preferences.
Observe the chart for signals:
Green arrows and lines indicate buy opportunities.
Red arrows and lines signal sell opportunities.
Use the alert system to stay informed about LRO thresholds and signal confirmations.
Integrate the indicator with your existing trading strategy for better decision-making.
Acknowledgement
This script was inspired by the Linear Regression Oscillator . While it builds on the core concept, this implementation introduces unique enhancements, such as dynamic signal integration, trading style adaptability, and advanced visualization tools, making it a highly customizable and versatile tool for traders.
Disclaimer
This indicator is intended for educational purposes only and should not be considered financial advice. Always perform due diligence and apply appropriate risk management when trading.

Custom ChoCH Indicator (10m) - SayajeeCustom ChoCH Indicator (10m) - Sayajee
This custom Pine Script indicator identifies and marks Change of Character (ChoCH) events on a 10-minute chart. ChoCH is a price action concept that highlights potential market reversals. The indicator detects bullish and bearish Change of Character points and displays them as labels and background color highlights on the chart.
Features:
Bullish & Bearish ChoCH Signals: Detects price reversals and trends based on the relationship between recent highs and lows.
Bullish ChoCH: When the close price is greater than the previous swing high and the previous low is lower than the previous swing low.
Bearish ChoCH: When the close price is lower than the previous swing low and the previous high is greater than the previous swing high.
Visual Indicators:
Labels ("ChoCH↑" for bullish, "ChoCH↓" for bearish) are displayed at the high or low of the bar where the signal occurs.
Background highlights in green for bullish and red for bearish conditions to make the signals easily recognizable.
Customization:
Option to toggle the visibility of labels.
Option to customize the colors for bullish and bearish signals.
Alerts: Configured alert conditions to notify you when a Bullish ChoCH or Bearish ChoCH occurs.
Inputs:
Show Labels for ChoCH: Toggle to display ChoCH labels on the chart.
Bullish ChoCH Color: Choose the color for bullish signals.
Bearish ChoCH Color: Choose the color for bearish signals.
Usage:
This indicator is useful for detecting potential trend reversals and market shifts, especially when combined with other technical analysis tools. It's designed for traders who rely on price action and prefer visual cues to make informed decisions.

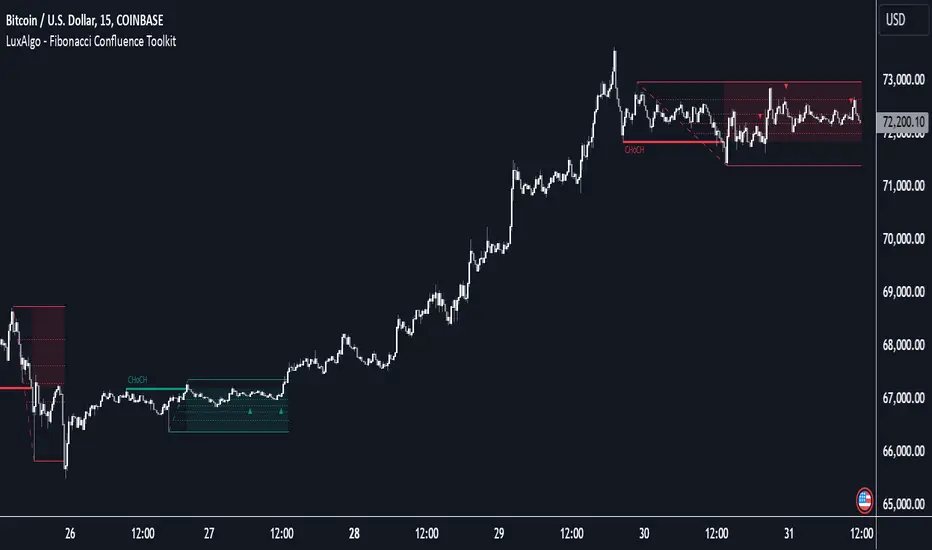
Fibonacci Confluence Toolkit [LuxAlgo]The Fibonacci Confluence Toolkit is a technical analysis tool designed to help traders identify potential price reversal zones by combining key market signals and patterns. It highlights areas of interest where significant price action or reactions are anticipated, automatically applies Fibonacci retracement levels to outline potential pullback zones, and detects engulfing candle patterns.
Its unique strength lies in its reliance solely on price patterns, eliminating the need for user-defined inputs, ensuring a robust and objective analysis of market dynamics.
🔶 USAGE
The script begins by detecting CHoCH (Change of Character) points—key indicators of shifts in market direction. This script integrates the principles of pure price action as applied in Pure-Price-Action-Structures , where further details on the detection process can be found.
The detected CHoCH points serve as the foundation for defining an Area of Interest (AOI), a zone where significant price action or reactions are anticipated.
As new swing highs or lows emerge within the AOI, the tool automatically applies Fibonacci retracement levels to outline potential retracement zones. This setup enables traders to identify areas where price pullbacks may occur, offering actionable insights into potential entries or reversals.
Additionally, the toolkit highlights engulfing candle patterns within these zones, further refining entry points and enhancing confluence for better-informed trading decisions based on real-time trend dynamics and price behavior.
🔶 SETTINGS
🔹 Market Patterns
Bullish Structures: Enable or disable all bullish components of the indicator.
Bearish Structures: Enable or disable all bearish components of the indicator.
Highlight Area of Interest: Toggle the option to highlight the Areas of Interest (enabled or disabled).
CHoCH Line: Choose the line style for the CHoCH (Solid, Dashed, or Dotted).
Width: Adjust the width of the CHoCH line.
🔹 Retracement Levels
Choose which Fibonacci retracement levels to display (e.g., 0, 0.236, 0.382, etc.).
🔹 Swing Levels & Engulfing Patterns
Swing Levels: Select how swing levels are marked (symbols like ◉, △▽, or H/L).
Engulfing Candle Patterns: Choose which engulfing candle patterns to detect (All, Structure-Based, or Disabled).
🔶 RELATED SCRIPTS
Pure-Price-Action-Structures.
16. SMC Strategy with SL - low TimeframeOverview
The "SMC Strategy with SL - low Timeframe" is a comprehensive trading strategy that uses key concepts from Smart Money Theory to identify favorable areas in the market for buying or selling. This strategy takes advantage of price imbalances, support and resistance zones, and swing highs/lows to generate high-probability trade signals.
The key features of this strategy include:
Swing High/Low Analysis: Used to determine the Premium, Equilibrium, and Discount Zones.
Order Block Integration: An added layer of confluence to identify valid buy and sell signals.
Trend Direction Confirmation: Using a Simple Moving Average (SMA) to determine the overall trend.
Entry and Exit Rules: Based on price position relative to key zones and moving average, along with optional stop-loss and take-profit levels.
Detailed Description
Swing High and Swing Low Analysis
The script calculates Swing High and Swing Low based on the most recent price highs and lows over a specified look-back period (swingHighLength and swingLowLength, set to 8 by default).
It then derives the Premium, Equilibrium, and Discount Zones:
Premium Zone: Represents potential resistance, calculated based on recent swing highs.
Discount Zone: Represents potential support, calculated based on recent swing lows.
Equilibrium: The midpoint between Swing High and Swing Low, dividing the price range into Premium (above equilibrium) and Discount (below equilibrium) areas.
Zone Visualization
The strategy plots the Premium Zone (resistance) in red, the Discount Zone (support) in green, and the Equilibrium level in blue on the chart. This helps visually assess the current price relative to these important areas.
Simple Moving Average (SMA)
A 50-period Simple Moving Average (SMA) is added to help identify the trend direction.
Buy signals are valid only if the price is above the SMA, indicating an uptrend.
Sell signals are valid only if the price is below the SMA, indicating a downtrend.
Entry Rules
The script generates buy or sell signals when certain conditions are met:
A buy signal is triggered when:
Price is below the Equilibrium and within the Discount Zone.
Price is above the SMA.
The buy signal is further confirmed by the presence of an Order Block (recent lowest price area).
A sell signal is triggered when:
Price is above the Equilibrium and within the Premium Zone.
Price is below the SMA.
The sell signal is further confirmed by the presence of an Order Block (recent highest price area).
Order Block
The strategy defines Order Blocks as recent highs and lows within a look-back period (orderBlockLength set to 20 by default).
These blocks represent areas where large players (smart money) have historically been active, increasing the probability of the price reacting in these areas again.
Trade Management and Trade Direction
The user can set Trade Direction to either "Long Only," "Short Only," or "Both." This allows the strategy to adapt based on market conditions or trading preferences.
Based on the Trade Direction, the strategy either:
Closes open trades that are against new signals.
Allows only specific directional trades (either long or short).
Stop-loss levels are defined based on a fixed percentage (stop_loss_percent), which helps to manage risk and minimize losses.
Exit Rules
The strategy uses stop-loss levels for risk management.
A stop-loss price is set at a fixed percentage below the entry price for long positions or above the entry price for short positions.
When the price hits the defined stop-loss level, the trade is closed.
Liquidity Zones
The script identifies recent Swing Highs and Lows as potential liquidity zones. These are levels where price could react strongly, as they represent areas of interest for large traders.
The liquidity zones are plotted as crosses on the chart, marking areas where price may encounter significant buying or selling pressure.
Visual Feedback
The script uses visual markers (green for buy signals and red for sell signals) to indicate potential entries on the chart.
It also plots liquidity zones to help traders identify areas where stop hunts and liquidity grabs might occur.
Monthly Performance Dashboard
The script includes a performance tracking feature that displays monthly profit and loss metrics on the chart.
This dashboard allows the trader to see a visual representation of trading performance over time, providing insights into profitability and consistency.
The table shows profit or loss for each month and year, allowing the user to track the overall success of the strategy.
Key Benefits
Smart Money Concepts (SMC): This strategy incorporates SMC principles like order blocks and liquidity zones, which are used by institutional traders to determine potential market moves.
Zone Analysis: The use of Premium, Discount, and Equilibrium zones provides a solid framework for determining where to enter and exit trades based on price discounts or premiums.
Confluence: Signals are not taken in isolation. They are confirmed by factors like trend direction (SMA) and order blocks, providing greater trade accuracy.
Risk Management: By integrating stop-loss functionality, traders can manage their risks effectively.
Visual Performance Metrics: The monthly and yearly performance dashboard gives valuable feedback on how well the strategy has performed historically.
Practical Use
Buy in Discount Zone: Traders would be looking to buy when the price is discounted relative to its recent range and is above the SMA, indicating an overall uptrend.
Sell in Premium Zone: Conversely, traders would be looking to sell when the price is at a premium relative to its recent range and below the SMA, indicating an overall downtrend.
Order Block Confirmation: Ensures that buying or selling is supported by historical price behavior at significant levels, providing confidence that the market is likely to react at these areas.
This strategy is designed to help traders take advantage of price inefficiencies and areas where institutional traders are likely to be active, increasing the odds of successful trades. By leveraging Smart Money concepts and strong technical confluence, it aims to provide high-probability trade setups.

Dynamic Trend Lines-AYNETCode Summary: Dynamic Trend Lines
This code dynamically draws trend lines and labels based on swing highs and lows identified from historical price action.
Key Features
Swing Point Detection:
Uses the ta.pivothigh and ta.pivotlow functions to identify recent swing highs and swing lows based on a customizable lookback period.
Trend Lines:
Uptrend Line:
Draws a line connecting swing low points.
Colored in blue by default.
Downtrend Line:
Draws a line connecting swing high points.
Colored in red by default.
Lines dynamically adjust as new swing points are identified.
Labels:
Adds a circle-style label at each swing high and swing low.
Displays the price value of the swing point.
Labels have:
Green background for uptrends.
Red background for downtrends.
Customizable Inputs:
lookback: Sensitivity of swing point detection (higher value = fewer swings).
line_color_up and line_color_down: Colors for the trend lines.
label_bg_up and label_bg_down: Colors for the label backgrounds.
Auto Updates:
Trend lines and labels update dynamically as the chart progresses, ensuring they reflect the latest market conditions.
How It Works
Identify Swing Points:
Detects local highs and lows within the defined lookback period.
Draw Lines:
Uptrend lines are drawn from the most recent swing lows.
Downtrend lines are drawn from the most recent swing highs.
Add Labels:
Each swing point is labeled with its price value for easy reference.
Visual Output
Trend Lines:
Blue for uptrends, red for downtrends.
Labels:
Circular labels with price values:
Green for swing lows (uptrend points).
Red for swing highs (downtrend points).
Example Use Case
This script is useful for traders who want to:
Visually identify key trend lines based on swing highs and lows.
Understand the critical price points of market reversals.
Use labeled price points for informed trade decisions.
Let me know if you'd like any specific refinements! 😊
Motive Wave Scanner [Trendoscope®]Motive Wave Scanner is a simple algorithm to find out motive waves as per the rules of Elliott Wave theory.
It is an extension to our previous open source script Interactive Motive Wave Checklist which provides interactive capability to select six points of a five wave formation. Once users select them, the rules of motive waves are applied to manually selected points to highlight them as either diagonal wave, motive wave or none.
This indicator does the same. But, instead of requesting the pivots manually from the user, the indicator automatically picks and scans them through zigzag.
We have already published a similar script as protected source. But, due to some changes in the pine engine, there have been few issues in the runtime. In this publication, we not only address those runtime issues but also making it open source for the users to make use of the source code and enhance it further.
🎲 What are motive waves
Motive waves are strong upward or downward movement with 5 subwaves.
Motive Wave in the upward direction will start with Swing High, Ends with Swing High and consists of 3 Higher Highs and 2 Higher Lows representing strong upward trend.
Motive Wave in the downward direction will start with Swing Low, Ends with Swing low and consists of 3 Lower Lows and 2 Lower Highs representing strong downward trend.
🎲 Types of Motive Waves
Motive Waves are broadly classified by two types:
Impulse Waves
Diagonal Waves
Diagonal Waves are further classified into Contracting and Expanding Diagonals. These can fall into the category of either leading diagonal and ending diagonal.
🎲 Rules of Motive Waves
🎯 Generic Rule of any motive waves are as follows
Should consist of 5 alternating waves. (Swing High followed by Swing low and vice versa)
This can start from Swing High and end in Swing High or start from Swing Low and end in Swing Low of a zigzag.
Wave-2 should not move beyond Wave-1. This means, the Wave-2 is always shorter than Wave-1 with respect to distance between the price of start and end.
Wave-3 always moves beyond Wave-1. This means, the Wave-3 is always longer than Wave-2 in terms of price
Among Wave-1, Wave-3, and Wave-5, Wave-3 is never the shortest one. This means, either Wave-1 or Wave-5 can be longer than Wave-3 but not both. Wave-3 can also be longest among the three.
Here is the pictorial representation of the rules of the Motive Waves
For a wave to be considered as motive wave, it also needs to follow the rules of either impulse or diagonal waves.
🎯 Rules for a 5 wave pattern to be considered as Impulse Wave are:
Wave-4 never overlaps with Wave-1 price range
Wave-1, Wave-3 and Wave-5 should not be either expanding or contracting. Meaning, we cannot have Wave-1 > Wave-3 > Wave-5 , and we cannot have Wave-1 < Wave-3 < Wave-5
Pictorial representation of the impulse wave rules are as below:
🎯 Rules for the Diagonal Waves are as follows
Contrary to the first rule of impulse wave, in case of diagonal wave, Wave-4 always overlaps with Wave-1 price range. But, it will not go beyond Wave-3
Waves are progressively expanding or contracting - Wave1 > Wave3 > Wave5 and Wave2 > Wave4 to be contracting diagonal. Wave1 < Wave3 < Wave5 and Wave2 < Wave4 to be expanding diagonal wave.
Pictorial representation of the Contracting Diagonal Wave is as below. Here, the Wave-1, Wave-3 and Wave-5 are in contracting formation.
Pictorial representation of the Expanding Diagonal Wave is as below. Here, the Wave-1, Wave-3 and Wave-5 are in expanding formation.
🎲 Indicator Settings
Indicator settings are defined as below:
Repaint Warning : If Repaint is selected, the indicator will throw a runtime error after certain bars or when alerts are set. This is due to some pine internal issue. At present, we do not have any solution for this until the internal issue is resolved by Tradingview Pine Team.